I've included some sample timelines below to illustrate certain concepts you may want to use with your own:
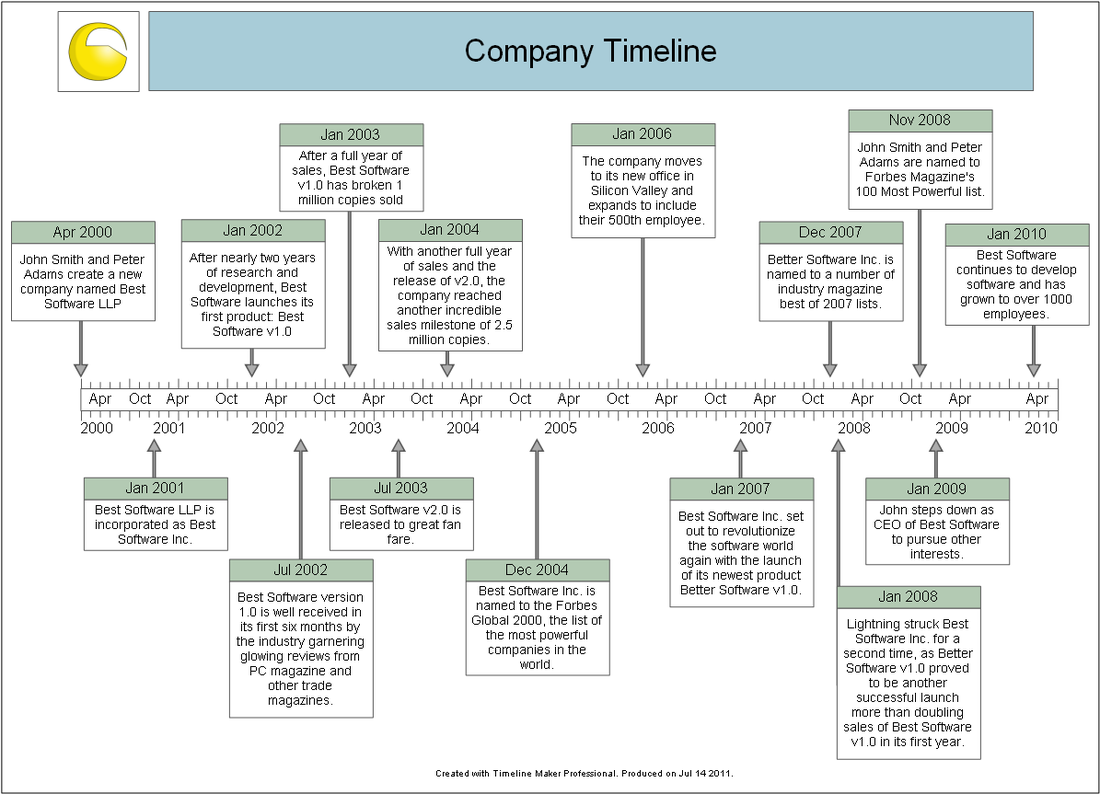
The timeline above is an example of a very simplistic version. At a minimum, yours should look like this, with a line down the centre of the page and arrows illustrating where the events you're describing fit over time...
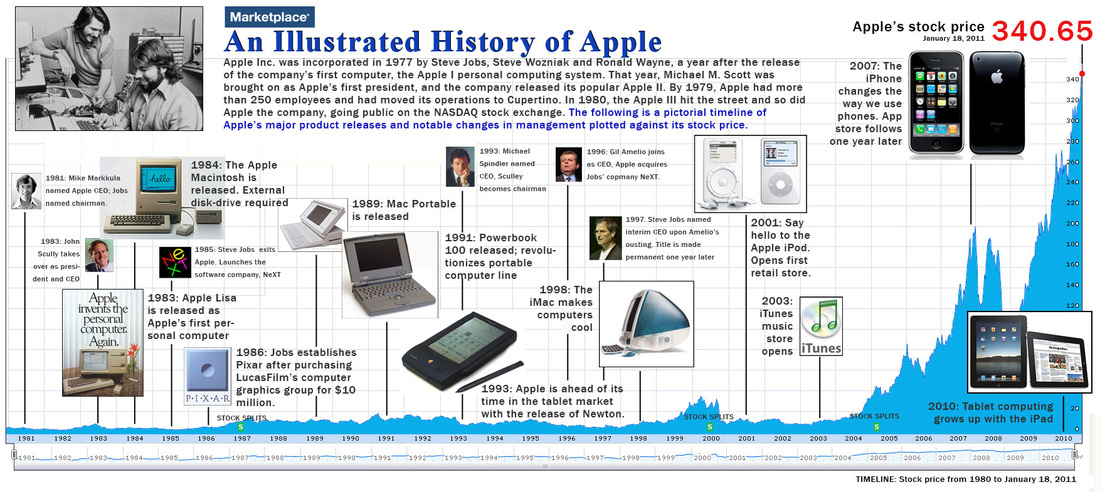
This next timeline illustrates two things. First, illustrations can help enhance meaning - feel free to use them when appropriate. Second, the line graph at the bottom illustrates the the stock price of Apple Corporation, allowing one to relate the company's value with the release of its products. This technique may be appropriate for certain aspects of your own timeline.
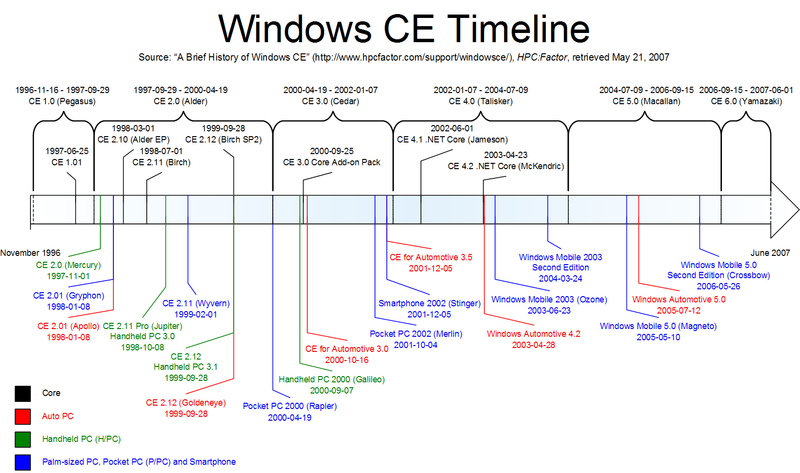
This last image demonstrates how you can illustrate events that happen over a period of time. This will definitely be relevant to your timeline as you go on with the project.
 RSS Feed